What does a tragedy look like when you step back from the poetry and chart the relationships instead? Can we map the betrayals, alliances, and power struggles of Macbeth? Yes. The result is a social network of the play.
Here’s the map: Macbeth as a network of characters and their interactions. You can watch it “read itself” scene by scene in the animation below.
Animated: How to Read This
- Characters (nodes): size = total lines; color = faction.
- Gray web: the full potential network (all shared-scene edges).
- Red spotlight: edges among speakers in the current scene.
The Spark: Digital Humanities and Distant Reading
This project borrows a simple idea from Martin Grandjean’s work: map the play like a social network. Each character is a circle (node), and a line (edge) connects characters who share a scene. In digital-humanities terms, that’s “distant reading”: instead of going line by line, you zoom out to see the play’s social shape: who stitches scenes together, which groups harden into factions, and the structural consequences of the play’s turning points.
The goal of this post is to share two things: social network maps of Macbeth, and the unique, conversational “vibe coding” process used to create them. This was a human-AI partnership where I provided the high-level direction, and the AI served as both a rapid coder and an analytical partner, helping to test hypotheses, explain results, and refine the data’s story.
A Map of Political Allegiance
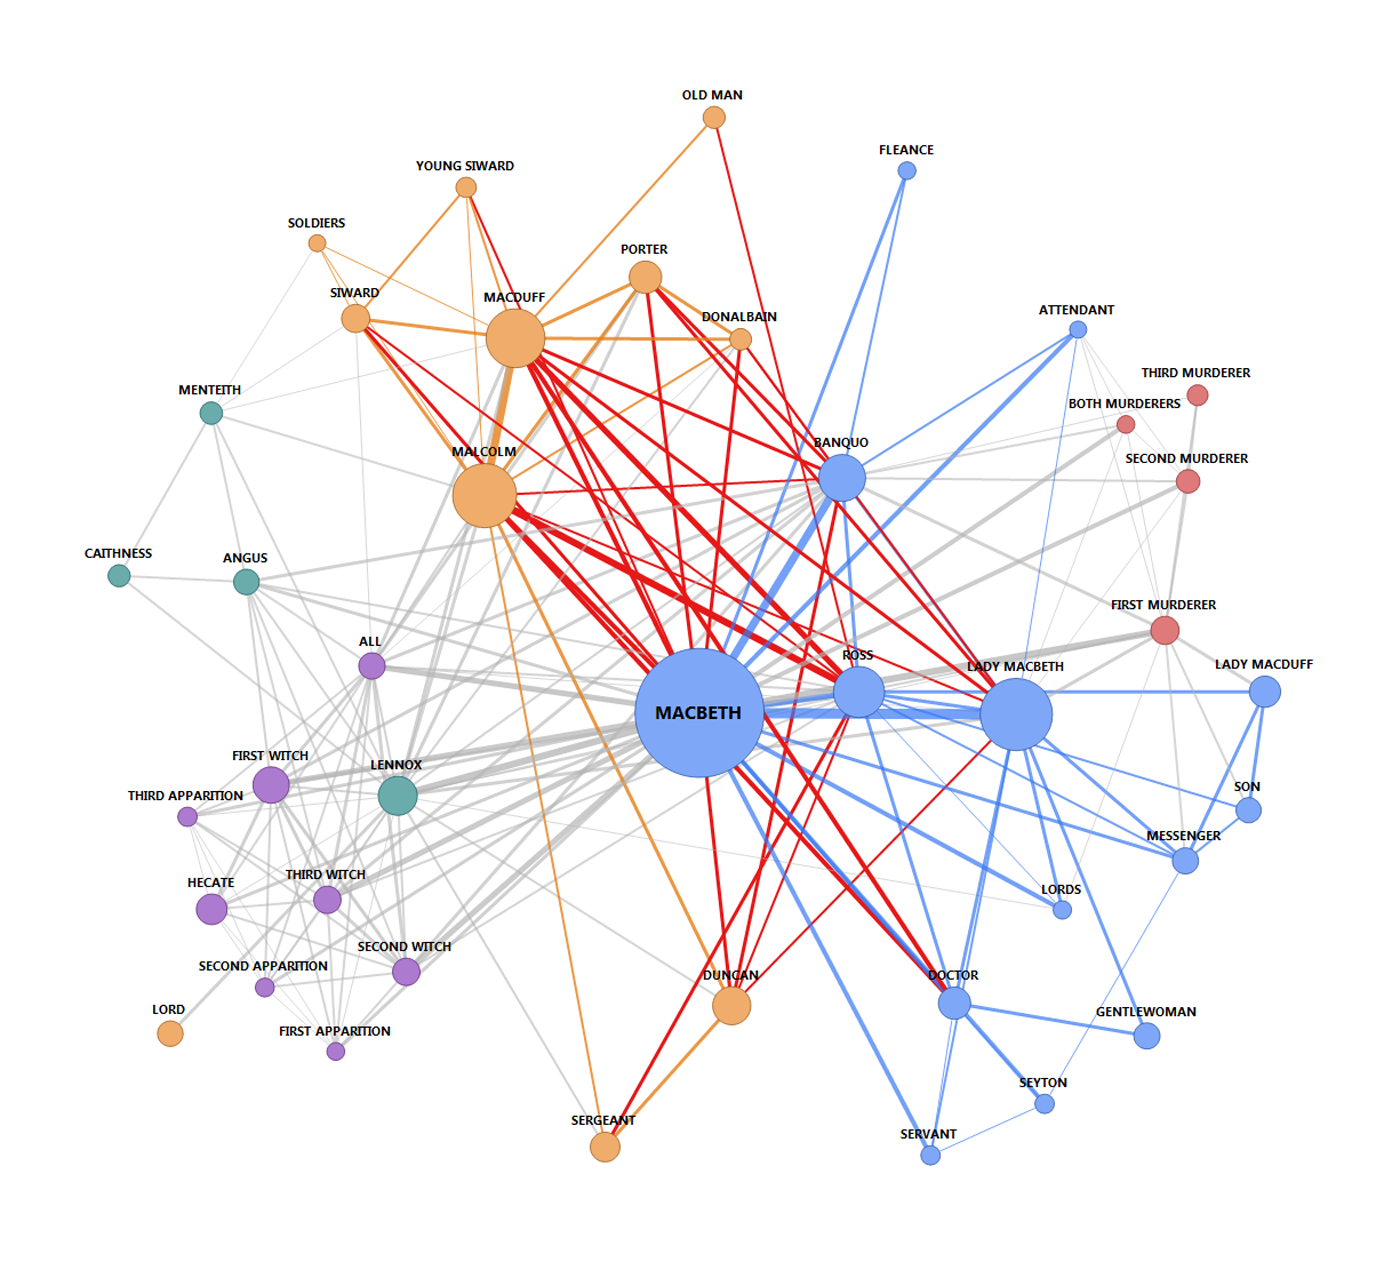
While the animation shows how the story unfolds over time, a static map can reveal the underlying political tensions across the entire play. To make these divisions clear, this version of the map uses a more detailed color scheme for the edges, while keeping the final node colors the same. This allows us to see the final state of the kingdom’s allegiances at a single glance.
A Map of Political Allegiance
How to Read This Map
|
NODE (Circle) Size: Represents the total number of lines spoken. (Larger = more lines) ● Royal Court (Macbeth)
● Opposition (Malcolm)
● Scottish Thanes
● Supernatural
● Murderers
|
EDGE (Line) Thickness: Represents “co-speech intensity.” (Thicker = more dialogue in shared scenes) ■ Connections within Macbeth’s court.
■ Connections within Malcolm’s opposition.
■ “Bridge” connections that cross between the two warring factions.
■ All other connections.
|
This “Political Allegiance” map allows us to analyze the final structure of the kingdom’s political divide, which we’ll explore in the sections below.
The Process: Collaborative “Vibe Coding” with AI
The term “vibe coding” describes the dynamic partnership that built this project. It wasn’t about a rigid plan; it was a flexible collaboration where I acted as the Director, setting goals and making final judgments, while the AI served as a rapid coder and an analytical partner.
Two key challenges perfectly illustrate this workflow:
1. How to Show a King and a Pawn?
The data showed a 718:1 range in line counts between Macbeth and some minor characters. A simple visual scale was impossible. The AI explained the data visualization concept of “power-law compression,” presenting different mathematical options. My role was to choose the final (lines)^0.7 formula to compress this extreme range. These compressed values were then linearly rescaled to a final on-screen radius between 2 and 15 points. This collaborative, two-step process was crucial for representing the data honestly: it guaranteed that even the most minor characters remained visible while ensuring Macbeth’s dominance was clear but not overwhelming.
2. When the Algorithm is Wrong (But Also Right)
The community detection algorithm initially grouped the Witches with the Scottish Thanes. The AI explained why this made sense mathematically: both groups are connected to the main network primarily through Macbeth.
But narratively, this is wrong. I provided the obvious human override, creating the separate “Supernatural” and “Thanes” factions. This was the perfect example of synergy: the AI found a surprising structural truth, and I layered the essential narrative meaning on top of it.
This process shows that “vibe coding” isn’t just about speed. It creates a rapid feedback loop between human intuition and data, allowing you to test ideas in minutes. This partnership allows you to test simple narratives against the data, often revealing more complex and surprising truths.
The Surprising Resilience of Macbeth’s Kingdom
A single glance at the “Political Allegiance” map confirms what every reader of the play already knows: Macbeth is the absolute center of his world. He is the structural hub (the character with the most direct connections), and the broker (the character on many of the shortest routes between others), through whom much of the play’s information flow appears to pass. But this very centrality raises a key question: is the kingdom’s social fabric as fragile as its king? If Macbeth is the structural center, is he also a single point of failure? To find out, we ran a simple but powerful experiment: what happens to the network if you remove him?
While his central position might suggest the network is fragile, the data reveals a different story: the network does not collapse.
This surprising resilience is quantified by the single most important metric in our analysis: the average path length (the average “degrees of separation” between any two characters). Before Macbeth’s removal, it takes an average of only 1.9 steps to connect any two people. After removing him, that number barely nudges to 2.1.
This result points to a political world with short routes between characters. The network’s average shortest path length is low, and it changes only slightly when the king is removed, suggesting that information can still travel through the remaining structure with little added “distance.”
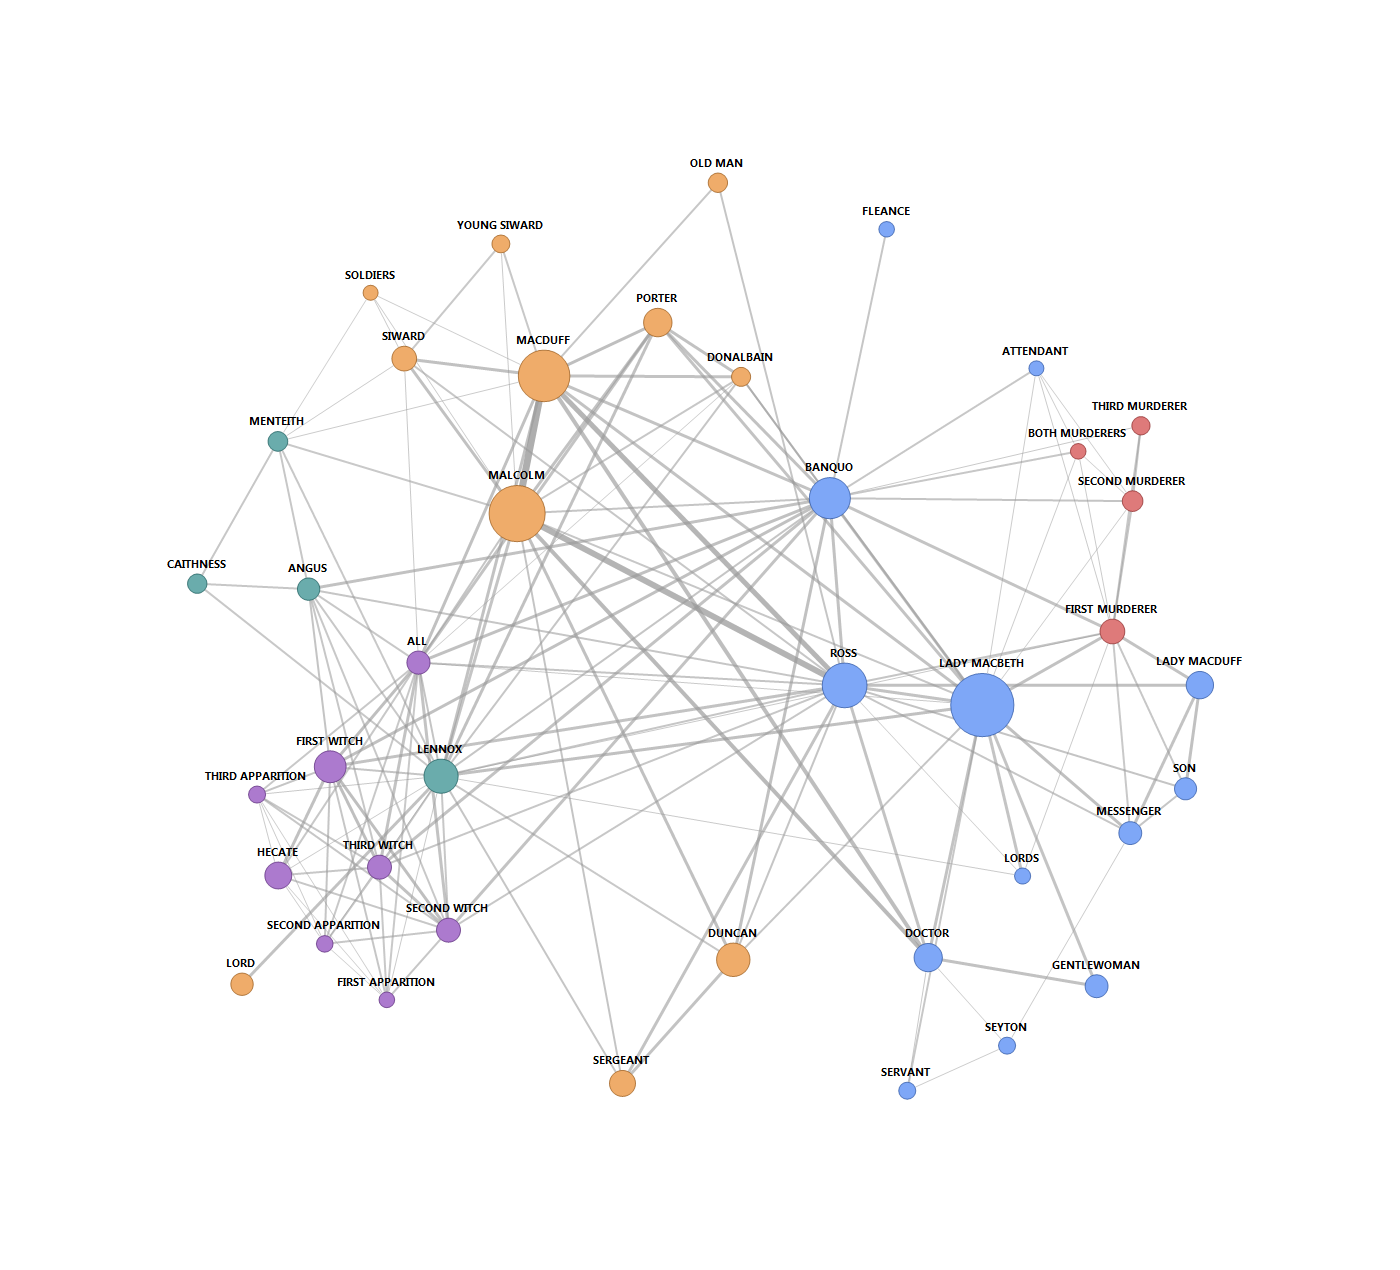
This structural resilience is not just a number; it can be seen. The following three-act story visualizes the “knock-out” experiment and its surprising result.
 |
 |
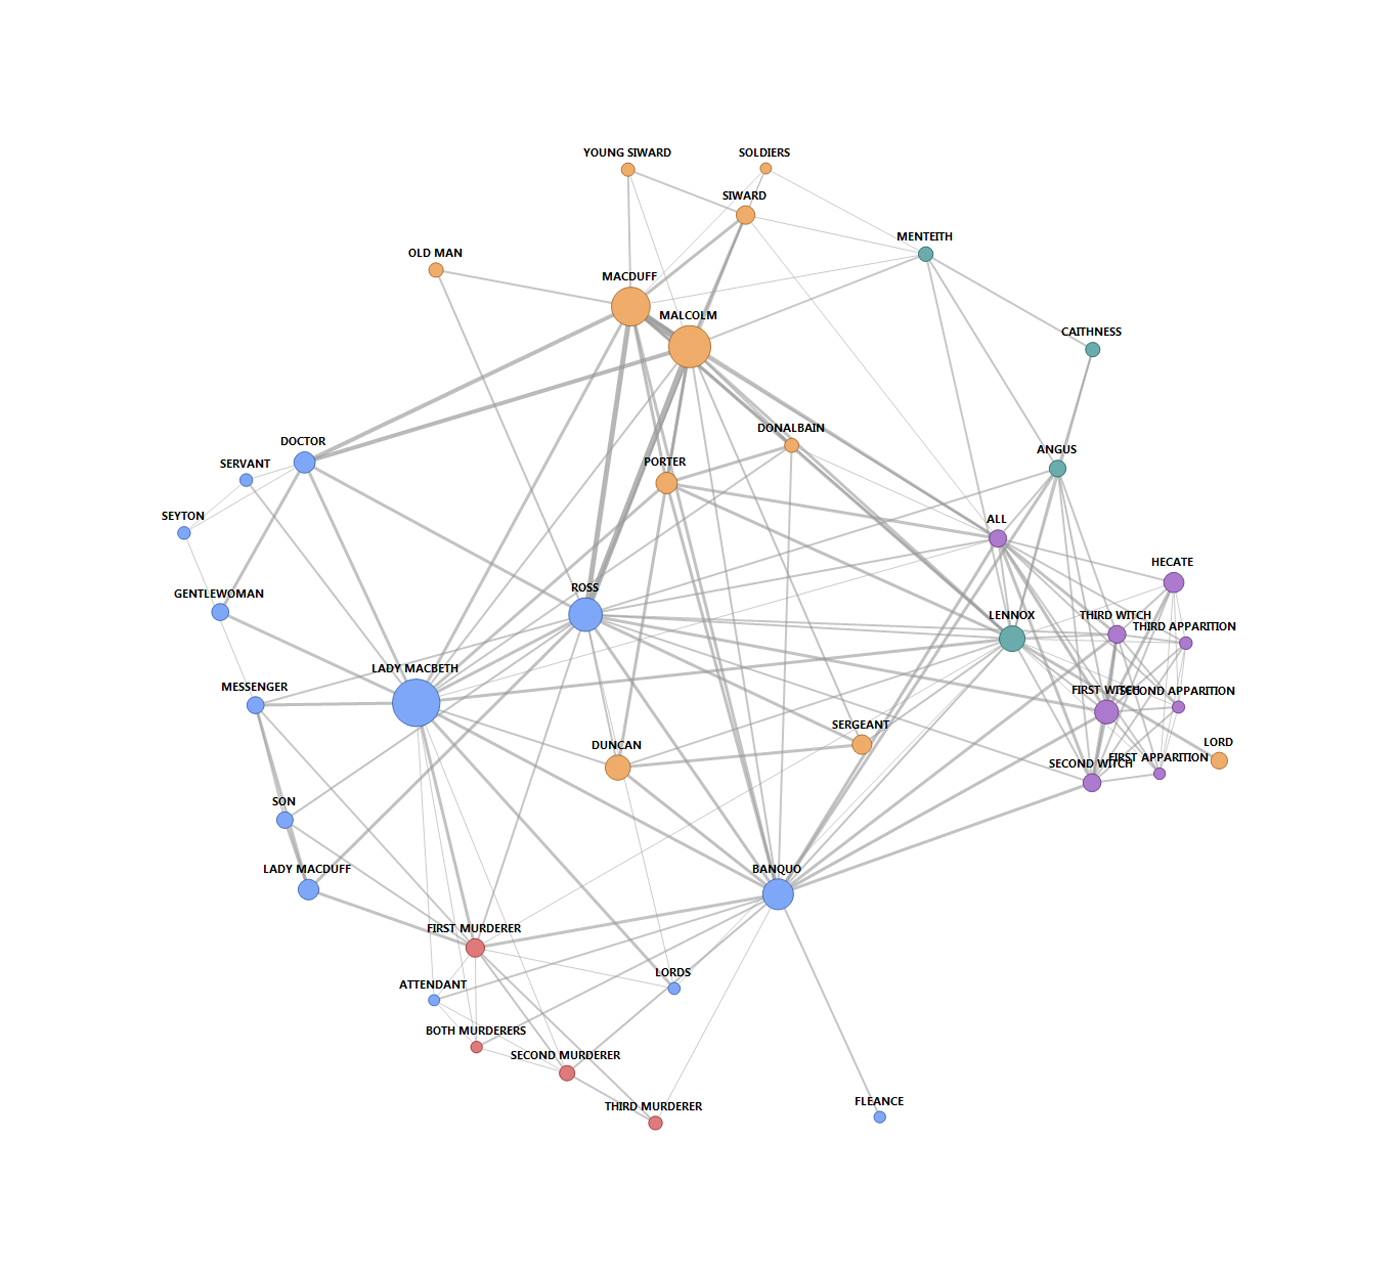 |
LCC: 41 → 40 | APL: 1.9 → 2.1 | Court↔Opposition Bridges: 25 → 18 (Δ = -7)
A Quick Guide to the Metrics
- Largest Connected Component (LCC): This is the size of the single largest group of characters who are all connected, directly or indirectly. The result to watch is not the drop from 41 to 40: that is just Macbeth himself leaving the graph. The result is what does not happen. If the court were a pure hub-and-spoke system, removing the hub would strand characters in disconnected “islands.” Instead, all 40 survivors remain in a single connected component.
- Average Path Length (APL): Often called “degrees of separation,” this is the average number of steps it takes to get from any character to any other. A low APL (like the ~2.0 in this network) reveals a “small-world-like” nature where information and influence can travel with surprising efficiency.
- Court↔Opposition Bridges: This is a simple count of the direct connections (edges) that cross between the two main warring factions (the blue and orange nodes). The drop from 25 to 18 quantifies how many of these crucial links were directly dependent on Macbeth himself.
How is this Resilience Possible?
The data tells a surprising story, but it’s one that is deeply rooted in the text of the play. The kingdom’s social network is able to survive the loss of its hub because, in many ways, it had already begun to operate without him. This happens for three key reasons.
1. The Hub Was Already Decaying
First, the “Hub” map reveals a striking contrast: Macbeth’s substantial power coexists with growing isolation. While his large node size proves he dominates the play’s dialogue, his personal network reveals a King who has lost his court.
This systematic destruction of his own inner circle is structurally visible on the “Political Allegiance” map if we look at who Macbeth is actually talking to:
A Fatal Link to the Enemy
The relatively thick line connecting Macbeth and Macduff is a clear example. While a strong link in a social network can suggest a close partnership, the faction overlay tells a different story: Macbeth is heavily linked to his enemy in the opposition (orange).
This is because the map’s edge thickness measures shared-scene dialogue volume, not affection. It encodes the total number of lines the two characters exchange across the play. A single, dialogue-heavy encounter, like the final confrontation between Macbeth and Macduff, can therefore produce a visually prominent link.
Dramatically, that relatively thick line doesn’t represent an alliance; it represents a fatal obsession. Macbeth is no longer governing, he’s locked in a high-intensity collision with the man coming to kill him.
His “Allies” are Subordinates
Now, look at the royal court (blue) nodes that remain connected to Macbeth. There are no powerful thanes or equals left. His strongest remaining “loyal” connections are to Lady Macbeth (his co-conspirator) and a scattered group of subordinates like Seyton and the Doctor.
His Court is Fragmented, Theirs is Resilient
Compare the shapes of the two armies. The blue “royal court” is essentially a star (hub-and-spoke) network: subordinates connect primarily to the king, with few links among themselves. In contrast, the orange “opposition” forms a denser web with more alternate routes, anchored by the “binary star” of Malcolm and Macduff.
The visualization captures a structural irony of the tragedy: the hub is still active, but the court around it has been hollowed out. Macbeth remains central, yet his most meaningful ties increasingly run to servants and enemies, not to a cohesive base of allies.
2. A New Center Was Already Forming
Second, the network is resilient because a stable alternative was already taking shape. While Macbeth’s court collapses inward, the faction overlay shows a new structural core emerging inside the Opposition.
That new center isn’t a single character but a dual leadership team: Malcolm and Macduff, a “binary star” at the heart of the orange cluster. Malcolm, the rightful heir, functions as the political hub, while Macduff, after Macbeth orders the murder of his wife and children, becomes the movement’s moral and military hub.
You can see the strength of their partnership directly in the data: the orange edge connecting Malcolm and Macduff is the single strongest internal bond in the Opposition. In their case, that backbone corresponds to the major England scene (Act 4, Scene 3), where Malcolm tests Macduff’s loyalty and they commit to action.
That backbone scene carries more than just dialogue weight: it’s where Shakespeare gives the opposition its moral vocabulary. Malcolm lists the “king-becoming graces” (justice, temperance, mercy, devotion) and claims them as his own. The play’s final moments return to this language: Malcolm pledges to restore Scotland “by the grace of Grace.” Compare that to how the text describes Macbeth’s Scotland. Ross, delivering news to the exiles, calls it a land that “cannot be called our mother, but our grave.” Macbeth himself is stripped of his name and referred to simply as “the tyrant.”
The contrast is deliberate. Grace versus grave. Legitimacy versus blood. The network data reflects this moral reality: the Opposition cluster is dense and resilient because it is bound by this shared “grace,” a common cause that allows nodes to trust one another. The tyrant’s court, bound only by fear, fragments the moment the center fails. Blood may seize a throne, but it cannot keep a kingdom.
The result is a coherent “government-in-exile” structure ready to take control. The network can withstand the loss of its old king because a new power structure is already in place. The network tells only part of this story. The force that finally removes the tyrant is English: Malcolm returns with Siward’s army behind him. The Scottish web proves it can reorganize, but the map cannot show that the decisive push came from outside it.
3. The Network’s Hidden Strength: The Quiet Broker
Finally, the network was resilient because it was inherently robust, with a hidden strength that went beyond its leaders. The data reveal that the “small-world-like” nature of the court is maintained by a key structural broker: Ross.
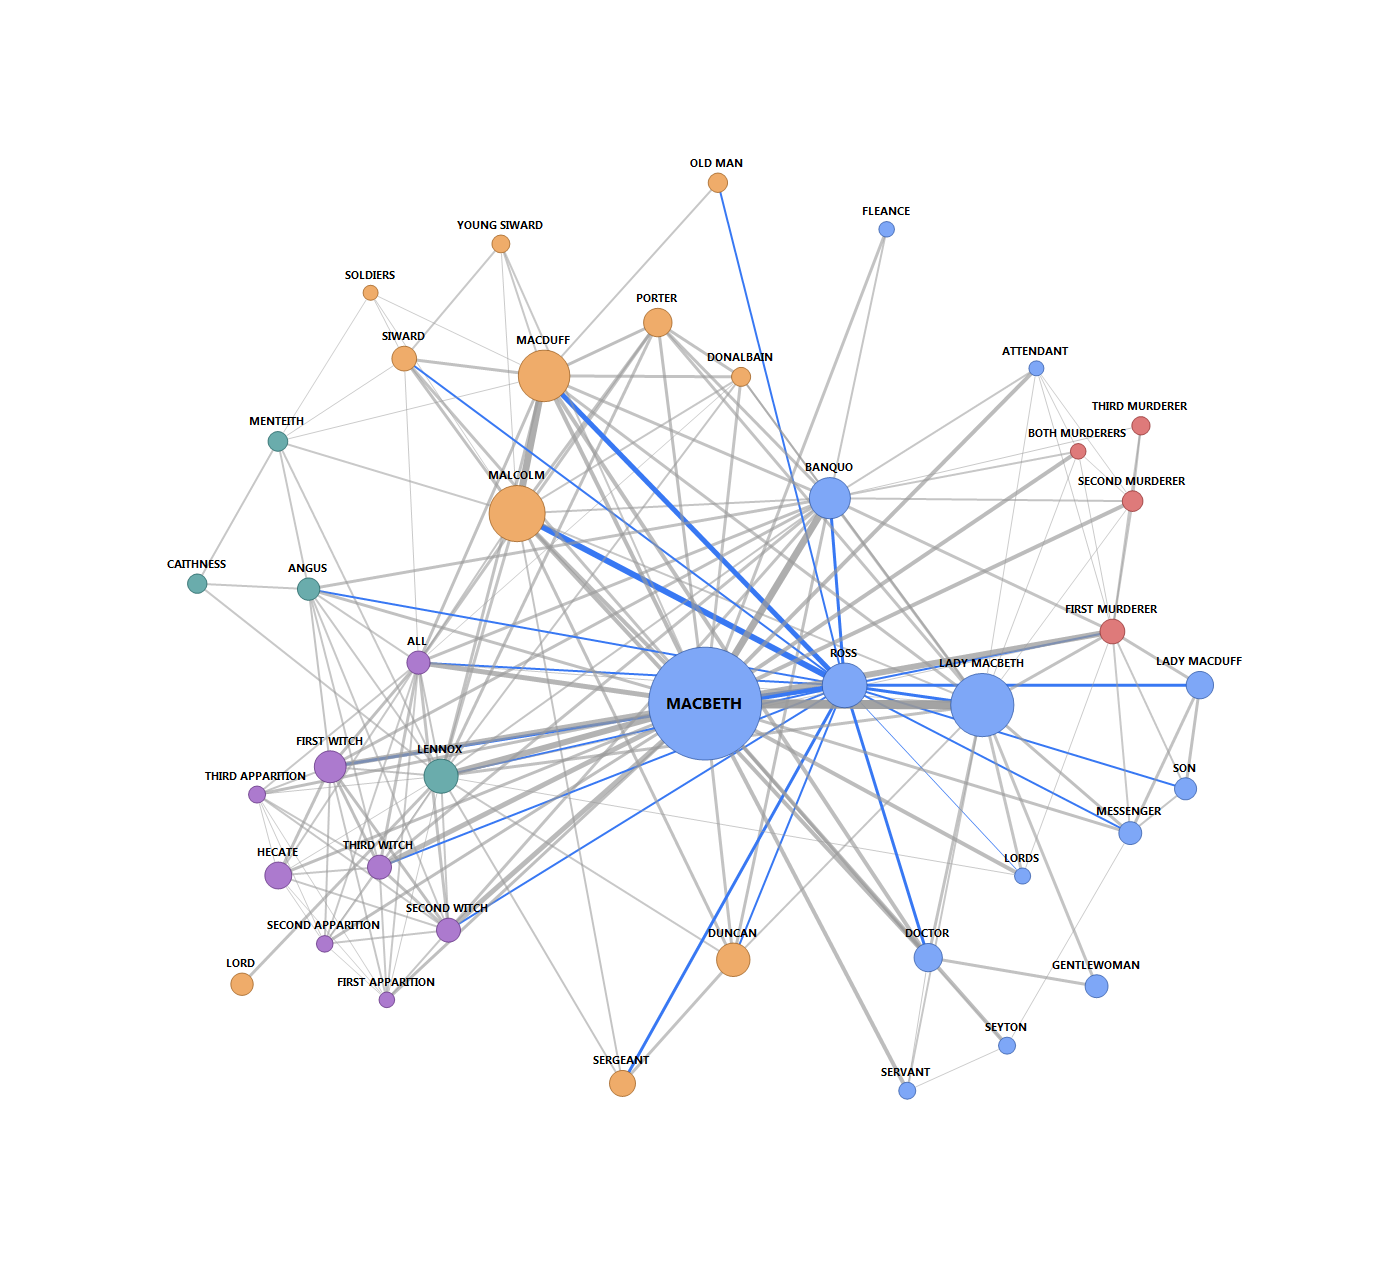
His importance is not that of a hub, but of a conduit. The map above shows his connections highlighted in blue reaching across all the play’s major factions, from the royal court to the Macduff household and the opposition in England. He is the quiet go-between.
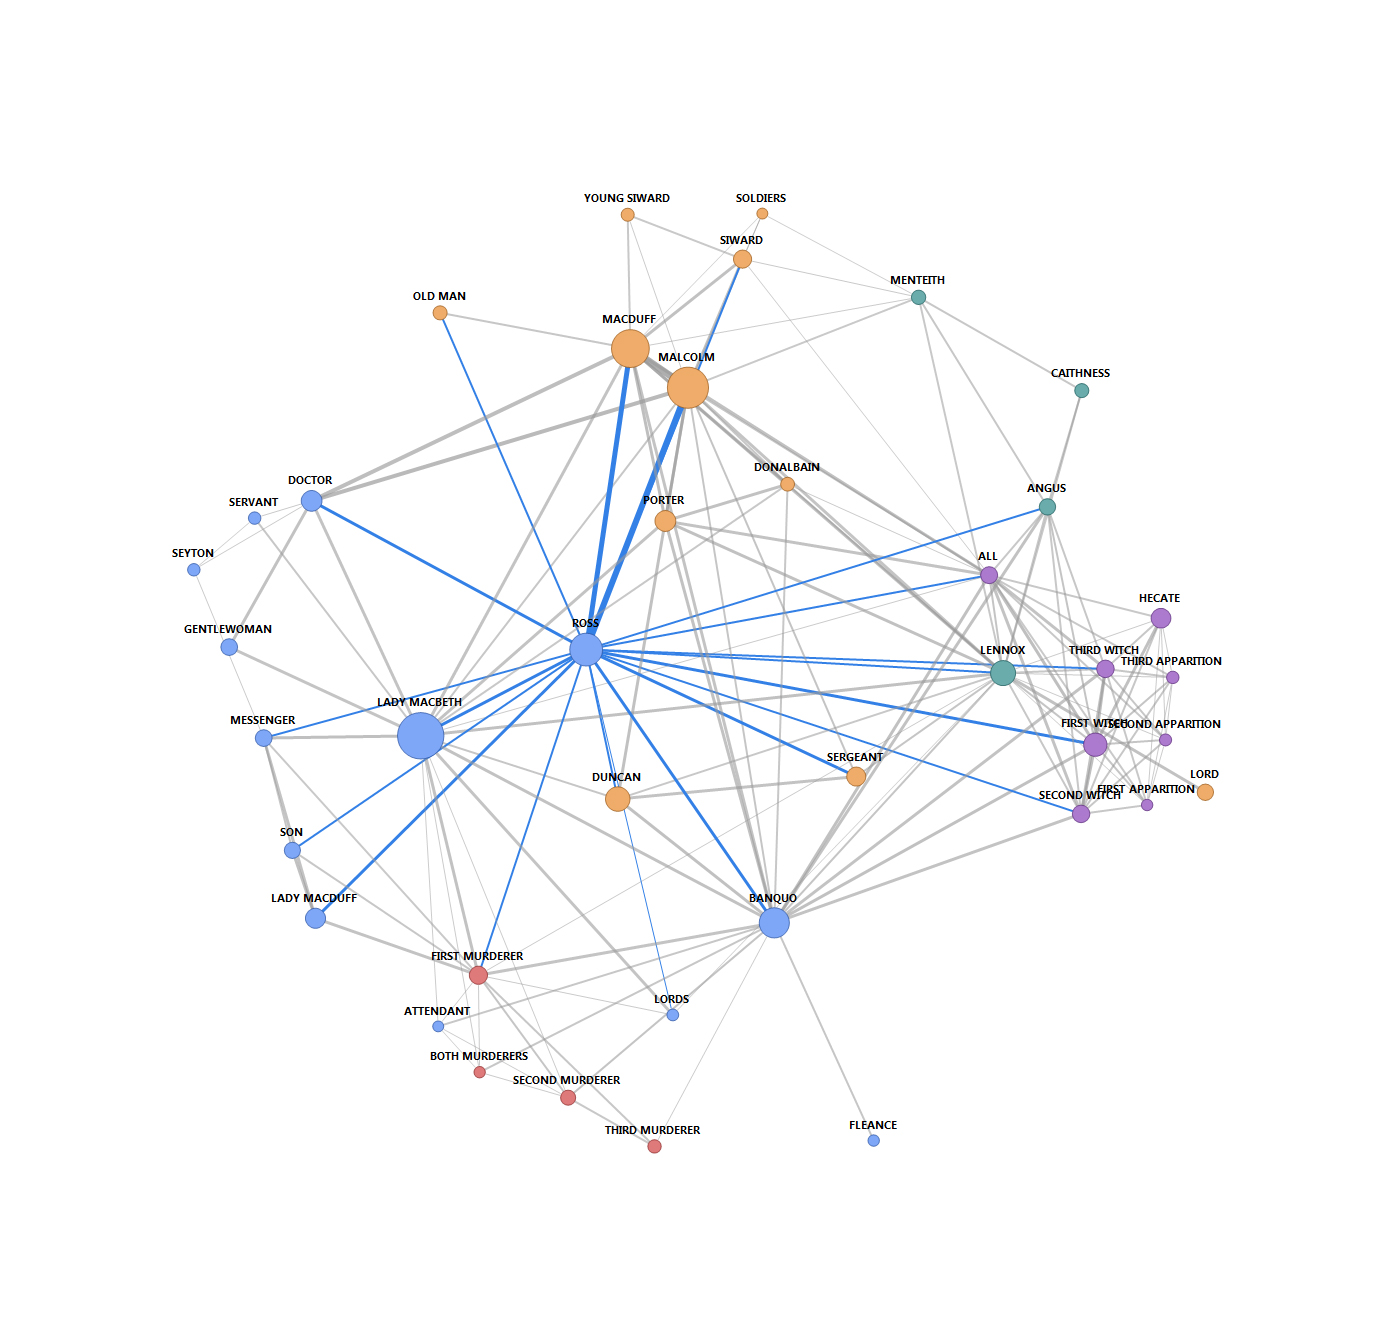
But his true structural importance is proven in the final “Resilient Kingdom” map. This visualization is not a counterfactual history; it is a structural stress test. By computationally removing the protagonist, we force the algorithm to rely on the secondary connections that Shakespeare quietly built into the background.
In this reorganized view, Ross doesn’t rise to power; he rises to necessity. The physics of the graph pull him to the center not because he rules, but because the distinct communities of the play (thanes, exiles, victims) become far less connected without him. The experiment shows that while the play is about Macbeth, the kingdom is built on Ross. He is the character whose connections are so diverse and strategic that they form the essential bridges holding the fractured but connected kingdom together.
This structural finding has a counterpart in how Shakespeare actually wrote the character. Ross functions almost exclusively as a bearer of news. He announces Macbeth’s new title, he arrives at the Macduff household with cryptic warnings, he delivers the devastating report of the family’s murder to Macduff in England. He observes, he conveys, but he rarely intervenes. And crucially, he serves both regimes: he operates within Macbeth’s Scotland while also appearing among the opposition in England, apparently trusted by all sides. His survival depends on a kind of studied uncommitment. He is useful to everyone precisely because he belongs fully to no one. In a kingdom torn by tyranny and faction, the figure who holds the social fabric together is not a hero or a loyalist, but a diplomatic survivor who knows how to move between worlds.
Ultimately, the network’s toughness comes from a system of brokers that creates redundant pathways. While many characters bridge different groups (like Lennox who connects the court to the defecting thanes), Ross is the most critical example. The presence of these multiple go-betweens allows the social fabric to withstand the loss of the tyrant. They provide the essential structural scaffolding that holds the kingdom together, allowing the network to shift its weight seamlessly to the new center of political power: the alliance of Malcolm and Macduff. This structural resilience is why the play doesn’t feel like it ‘ends’ when Macbeth falls; the community survives.
A New Way to See, A Partner in Insight
A skilled reader can certainly sense the play’s competing networks: Macbeth’s hub of power, built on fear, and the resilient web of nobles that ultimately survives him. From A.C. Bradley’s studies of tragic isolation to Stephen Greenblatt’s argument that Macbeth dramatizes how legitimate authority survives a usurper, critics have long intuited this structure. The network map doesn’t replace that intuition; it makes it concrete. It transforms a feeling about the text into a measurable, visual fact.
Normally, creating this visual proof would mean coding solo in Mathematica. But the “vibe coding” workflow changed the dynamic entirely. The speed of the process didn’t just save time; it created a rapid feedback loop that allowed for failure and immediate iteration. Because I could generate a new map in minutes, I could afford to test a hypothesis, see that it was flawed (like our initial, incorrect color-coding), and quickly refine my approach.
This is the true power of the partnership: my intuition guides the questions, while the AI serves as an analytical partner, offering options, explaining complex concepts, and surfacing the data to test our ideas. A perfect example occurred during the “Macbeth Removal” experiment. While the AI initially predicted the graph would shatter into an “archipelago of islands,” my eyes saw a structure that held together. We used a mathematical tie-breaker, Average Path Length, to resolve the debate. The numbers vindicated my observation, forcing the AI to abandon its prediction of a shattered map. This constant back-and-forth is what led to the project’s key discoveries, most notably the hidden centrality of Ross, and ultimately forced the move from a simple story to a more complex, data-driven truth.
What are your thoughts on this process and the patterns in the maps? I’d love to hear your interpretation.
Leave a comment on X (formerly Twitter).
Acknowledgments
AI models from OpenAI (ChatGPT-5 Thinking) and Google (Gemini 2.5 Pro and Gemini 3 Pro Preview) were used to help draft, edit this post, and for code iteration. Claude (Anthropic, most recently Claude Fable 5) served as a critical reader, contributing critique and revisions throughout the post. The final choices, errors, and opinions are my own.
Method Notes
- Data Source: This analysis uses the MIT Shakespeare text of Macbeth. The full play text was accessed at http://shakespeare.mit.edu/macbeth/full.html. As of 2023-05-10, MIT notes a maintained copy in the MIT Tech repository, hosted by MIT IS&T in a static location: https://github.com/TheMITTech/shakespeare/blob/master/macbeth/full.html. The original electronic source for this server was the Complete Moby™ Shakespeare. For this project, the HTML was parsed into a JSON structure for processing.
- Node Definition: Each of the 41 unique raw speaker labels in the text (e.g., “First Murderer”) was treated as a distinct node. The complete list of all 41 speakers, along with their total line and scene counts, is available for review in this Google Sheet.
- Edge Definition (Co-Speech Intensity): Edges are undirected and connect characters who speak in the same scene. The edge weight is a measure of co-speech intensity, calculated by summing the total number of lines spoken by both characters across all scenes they share. This model was chosen to emphasize the most dialogue-heavy and narratively significant interactions over simple co-presence. One known trade-off: the weight sums each character’s total lines in shared scenes, so a talkative character inflates every edge they touch. In the banquet scene, every guest present gains edge weight from Macbeth’s outbursts, whether or not they exchange a word with him. Edge weight therefore partly encodes verbosity, a node property, rather than pure interaction. The Malcolm and Macduff bond is robust to this concern: their backbone scene (Act 4, Scene 3) is nearly a two-person exchange.
- Node Size Encoding: Node radius is determined by a two-step process. First, a power-law compression (radius ∝ (Total Lines)^0.7) was used to manage the data’s extreme 718:1 dynamic range. These compressed values were then linearly rescaled to a final on-screen radius between 2 and 15 points. This two-step process ensures that major characters like Macbeth are prominent while guaranteeing that even the most minor characters (with a single line) remain clearly visible.
- Edge Style Encoding: Edge thickness and opacity are proportional to the sqrt(weight). This transformation ensures perceptual linearity, correcting for the human eye’s non-linear perception of thickness and preventing the most intense connections from visually overwhelming all others.
- Layout and Reproducibility: The layout was generated using Mathematica’s SpringElectricalEmbedding, a force-electrical layout on an unweighted version of the graph. It is important to note that the initial layout process was not seeded, so a full re-run by a third party may produce a layout with different rotations or mirroring. However, to ensure the validity of our structural comparisons, we used a strict coordinate system. The final node coordinates from the main graph were exported. For the “Void” model, these exact coordinates were reloaded to guarantee perfect alignment and demonstrate the structural hole. In contrast, for the “Resilient Kingdom” model, the layout was intentionally recalculated from scratch on the remaining 40 nodes to show how the network naturally reorganizes itself into a new stable state.
- Faction Assignment (Final-State Model): Factions were determined using a baseline from a Louvain modularity optimization algorithm (Blondel et al., 2008), followed by expert-guided, manual overrides to ensure narrative accuracy. Crucially, this is a “final-state” model: each character is assigned a single faction color based on their ultimate allegiance at the end of the play. For example, Lennox is colored Teal (Scottish Thanes) for the entire analysis, even though he begins as a member of Macbeth’s court. This approach was chosen to best illustrate the final political realignment of the kingdom.
- Software: All analysis and visualization were performed in Wolfram Mathematica v12.1.